Interactive Visualizations
Cool interactive maps can be created using the leaflet package. It is pretty straightforward:
library(leaflet)
library(tidyverse)

citibike <- read_rds('data/201508.rds')

## summarize data to plot
station.info <- citibike %>%
  group_by(start.station.id) %>%
  summarise(lat=as.numeric(start.station.latitude[1]),
            long=as.numeric(start.station.longitude[1]),
            name=start.station.name[1],
            n.trips=n())


## make plot with station locations
leaflet(station.info) %>%
  addTiles() %>%
addCircles(lng = ~long, lat = ~lat) 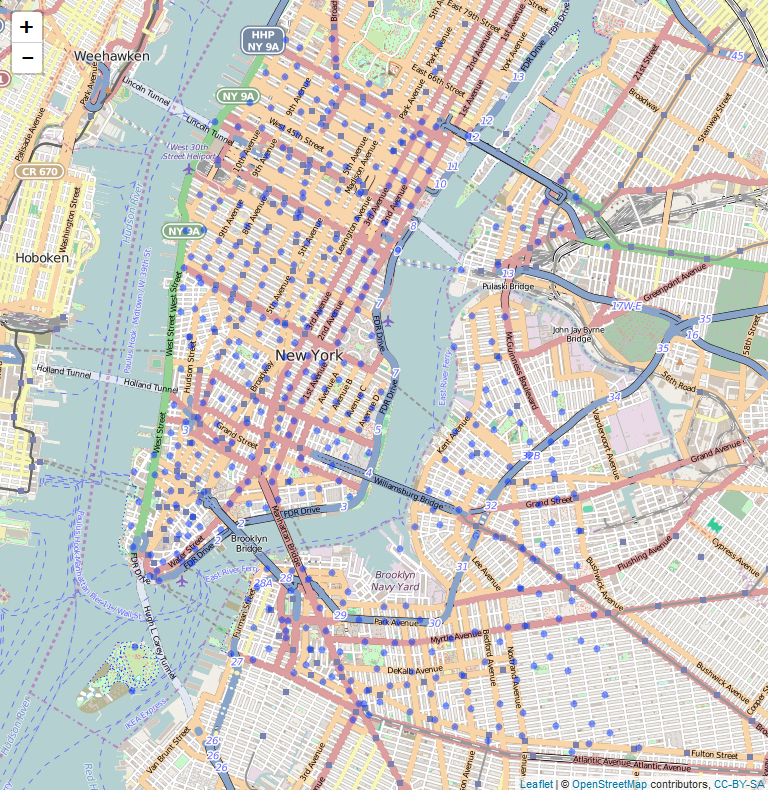
When you plot this in Rstudio you can zoom in and out of the plot (too see what it looks like click on the map above). At a later module we will look at how to intergrate interactive maps into web-pages and html presentations.
You often want to add information to the markers in the maps. Again easy:
station.info <- citibike %>%
  group_by(start.station.id) %>%
  summarise(lat=as.numeric(start.station.latitude[1]),
            long=as.numeric(start.station.longitude[1]),
            n.trips=n(),
            name=paste0(start.station.name[1],'<br/>','Number of Trips: ',n.trips))


leaflet(station.info) %>%
  addTiles() %>%
addCircles(lng = ~long, lat = ~lat, popup = ~name) 
You can add further information and use an html break where you want line breaks:
station.info <- citibike %>%
  group_by(start.station.id) %>%
  summarise(lat=as.numeric(start.station.latitude[1]),
            long=as.numeric(start.station.longitude[1]),
            n.trips.subscriber=sum(usertype=='Subscriber'),
            n.trips.customer=sum(usertype=='Customer'),
            n.trips = n(),
            name=paste0(start.station.name[1],'<br/>',
                        'Number of Customer Trips: ',n.trips.customer,'<br/>',
                        'Number of Subscriber Trips: ',n.trips.subscriber))

leaflet(station.info) %>%
  addTiles() %>%
addCircles(lng = ~long, lat = ~lat, popup = ~name) 
Here is a version with less clutter and circle size conveying information (here number of trips):
leaflet(station.info) %>%
  addTiles() %>%
  addCircles(lng = ~long,
             lat = ~lat,
             weight = 1,
             radius = ~sqrt(n.trips)*2,
             popup = ~name) %>%
addProviderTiles("CartoDB.Positron") 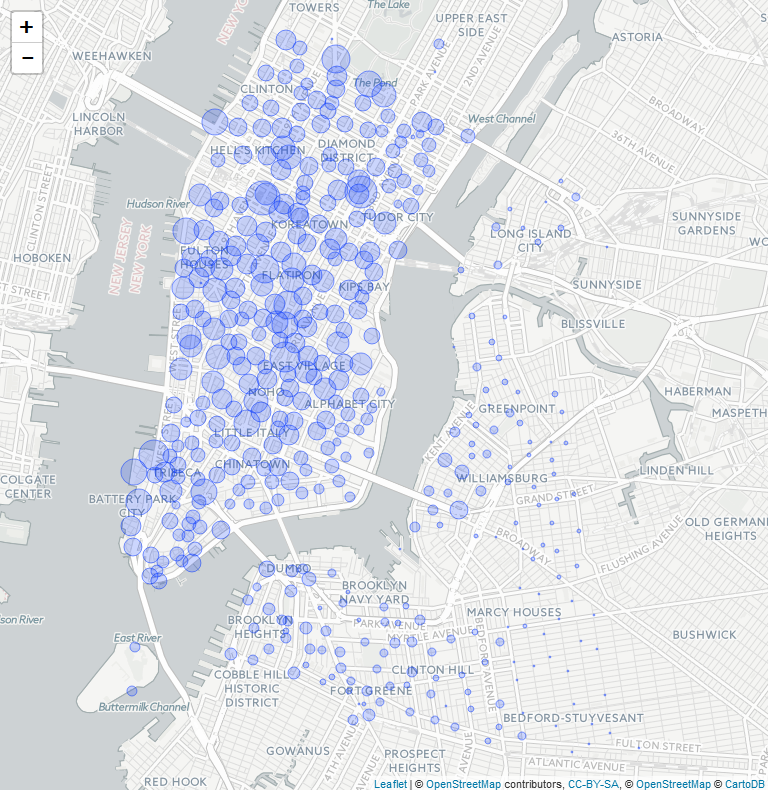
Copyright © 2016 Karsten T. Hansen. All rights reserved.