Text as Data
 Any information that can be digitized is data. Text can be digitized (you are reading some in digital format right now). Therefore text (and speech) is data. We can synthesize large amounts of text using analytical tools which allows us to see patterns that otherwise would be hidden. This is, of course, of huge importance here in the early 21st century where vast amounts of text is generated and published in various formats every day.
As a first example of using text as data, consider Google’s Ngram database. This contains the word frequencies of all words in the collection of books (known as a “corpus”) scanned by Google. This is a lot - a lot a lot (supposedly around 500 billion words - but really - with numbers like this who is even counting anymore?). You can access the database through Google’s web interface here. However, that’s for the common folk - as a serious data scientist you want to load the data into R on your own and then use it for visualizations and other analyses. You can do this through the R library ngramr. It is laughably easy to do. Let’s see the evolution of societal hot button issues over the last 60 years as reflected in word frequencies in the Google Ngram corpus:
library(ngramr)
library(ggplot2)

ng  <- ngram(c("abortion","homosexual","gun rights","communism","capitalism",
               "global warming","drugs","pornography"), year_start = 1950)

ggplot(ng, aes(x=Year, y=Frequency, color=Phrase)) +
  geom_line() + facet_wrap(~Phrase,scales='free',nrow = 2) +
  theme(legend.position="none",
        axis.text.x = element_text(angle = 45, hjust = 1))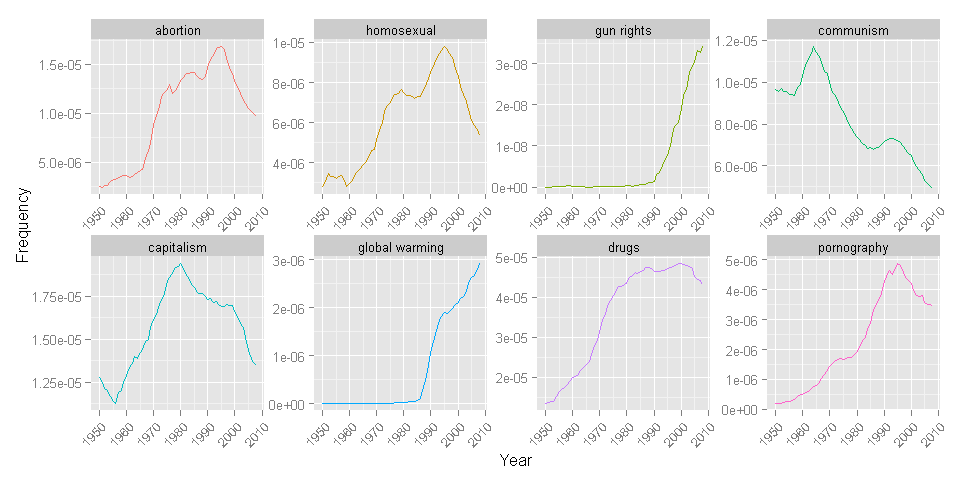
The word frequencies are collected in the ng data frame which we then visualize using ggplot. We see some issues increasing and then decreasing (e.g., abortion and communism) while others don’t appear until late in the period (e.g., global warming). Text - in this case books - reflects changes in society.
Playing with the Google Ngram database has high entertainment value but we need more flexible tools. For example, we need to be able to analyze our own text collections rather than relying on Google’s. This is the subject of the next section.