Data
The Behavioral Risk Factor Surveillance System (BRFSS) is an annual survey conducted by the Centers for Disease Control (CDC). The central focus of the survey is to measure preventative behaviors and practices and associated health outcomes for US adults. The survey has been administered since 1984 and currently over half a million interviews are conducted per year.
We pool the surveys for the years 2006-2010 which covers the years in which the life satisfaction question was included in the survey. The total sample size of respondents who answered the central life satisfaction question is 1,988,275. The full data including all respondents from the 2006-2010 BRFSS (only the subset variables from the full survey that we use), FIPS code county location for each respondent and county level characteristics can be downloaded here.
Since we wish to explain variation in satisfaction by respondents’ demographics, we filter the data to delete missings for variables used in the analysis. We eliminate respondents with missing values for demographics and county locations. We also only include responses for White, Black and Hispanic respondents. Finally, since we want to control for location effects we also eliminate respondents from counties where we observe 50 or fewer respondents. R code for filtering the data can be obtained here.
We use the following variables from the BRFSS:
| BRFSS Variable | Notation | Description | Selection Rule |
|---|---|---|---|
| INCOME2 | Income | Annual Income | Removed missing values |
| AGE | Age | Age in years | Removed missing values |
| MARITAL | Marital | Marital Status | Removed missing values |
| SEX | Gender | Gender of respondent | |
| CHILDREN | Children | Number of children in household | Removed missing values |
| EMPLOY | Employment | Employment Status | Removed missing values |
| GENHLTH | Health | General Health | Removed missing values |
| RACE2 | Race | Race | Include only White, Black and Hispanic respondents |
| CTYCODE | County | County FIPS CODE | Removed observations from unknown counties, counties with less than 50 respondents and counties where county level demographics were not available |
These selection rules lowers the sample size from 1,988,275 to 1,390,826 (the filtered data can be downloaded from here). The effect of each variables selection rule is shown in the left figure below. The biggest reduction is due to missing income observations and removing observations from counties with a low number of respondents. However, the sample selection doesn’t bias the average response of the key outcome variable: The proportions for each level of the satisfaction measure is not affected by the selection rules.
Figure: Effect of Sample Selection rules on Sample Size and Outcome Measure. The left chart shows the effect of successive sample selection rules on final sample size. The right chart compares the distributions of the satisfaction measure for the full and final (filtered) sample.
Variable Coding
Variables are coded using the following categories:
| Age | Income | Health | Employment | Children | Marital | Race | Satisfaction |
|---|---|---|---|---|---|---|---|
| <20 | <$10,000 | Excellent | Employed | No Children | Married | White | Very Satisfied |
| 20-24 | $10,000-$15,000 | Very Good | Self-employed | 1 | Divorced | Black | Not Very Satisfied |
| 25-29 | $15,000-$15,000 | Good | Out of work > 1 year | 2 | Widowed | Hispanic | |
| 30-34 | $20,000-$25,000 | Fair | Out of work < 1 year | 3 | Separated | ||
| 35-39 | $25,000-$35,000 | Poor | Homemaker | 4 or more | Never Married | ||
| 40-44 | $30,000-$50,000 | Student | Unmarried Couple | ||||
| 45-49 | $50,000-$75,000 | Retired | |||||
| 50-54 | $75,000+ | Unable to Work | |||||
| 55-59 | |||||||
| 60-64 | |||||||
| 65-69 | |||||||
| 70-74 | |||||||
| 75-79 | |||||||
| 80-84 | |||||||
| 85+ |
Note we are coding the satisfaction measure as binary: Very Satisfied or Not Very Satisfied. This due to almost all respondents reporting their satisfaction as being in one of the top two categories (see figure above).
County Level Data
From the BRFSS we know county of residence for each respondent. To measure effects of county characteristics we merge county level measures with the survey data.
| VARIABLE | Description | Source | Coding |
|---|---|---|---|
| County.Gini | County GINI coefficient | US Census | Quintiles |
| County.Income | County Income | US Census | Quintiles |
| County.Unemp | County Unemployment rate | US Census | Quintiles |
| County.Romney | County Vote Pct. for Mitt Romney, 2012 Election | ???? | Quintiles |
| County.Religion | Size of Evangelical Congregation | ???? | Quintiles |
| County.Race | Racial make-up of county | US Census | 6 Categories |
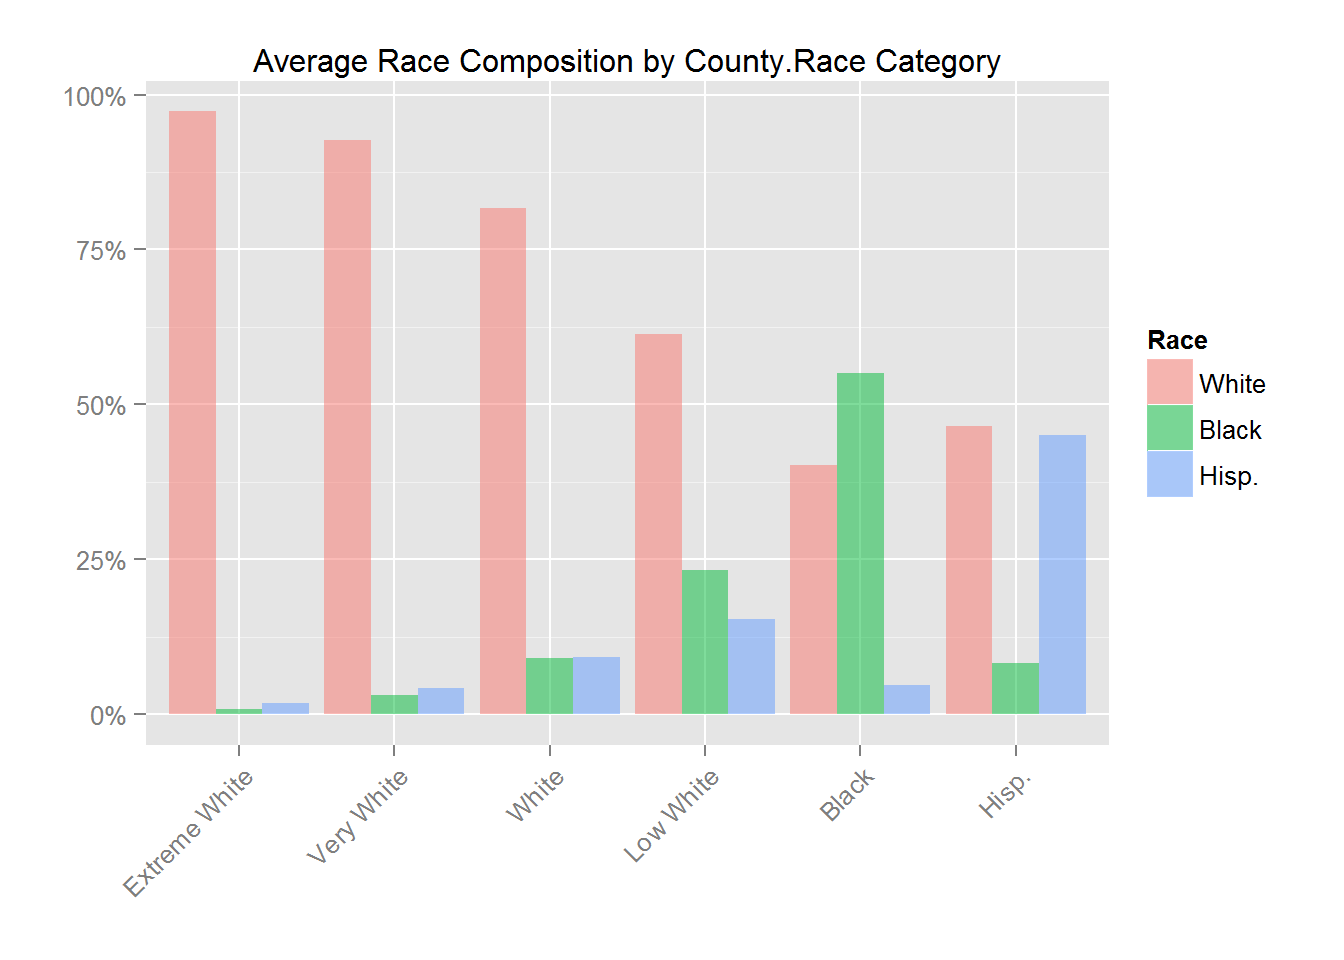
The COUNTY.RACE variable consists of 6 categories corresponding to different sizes of the White, Black and Hispanic population. In the figure below we show the average fraction of each of these three populations for the 6 categories.
Data Summaries
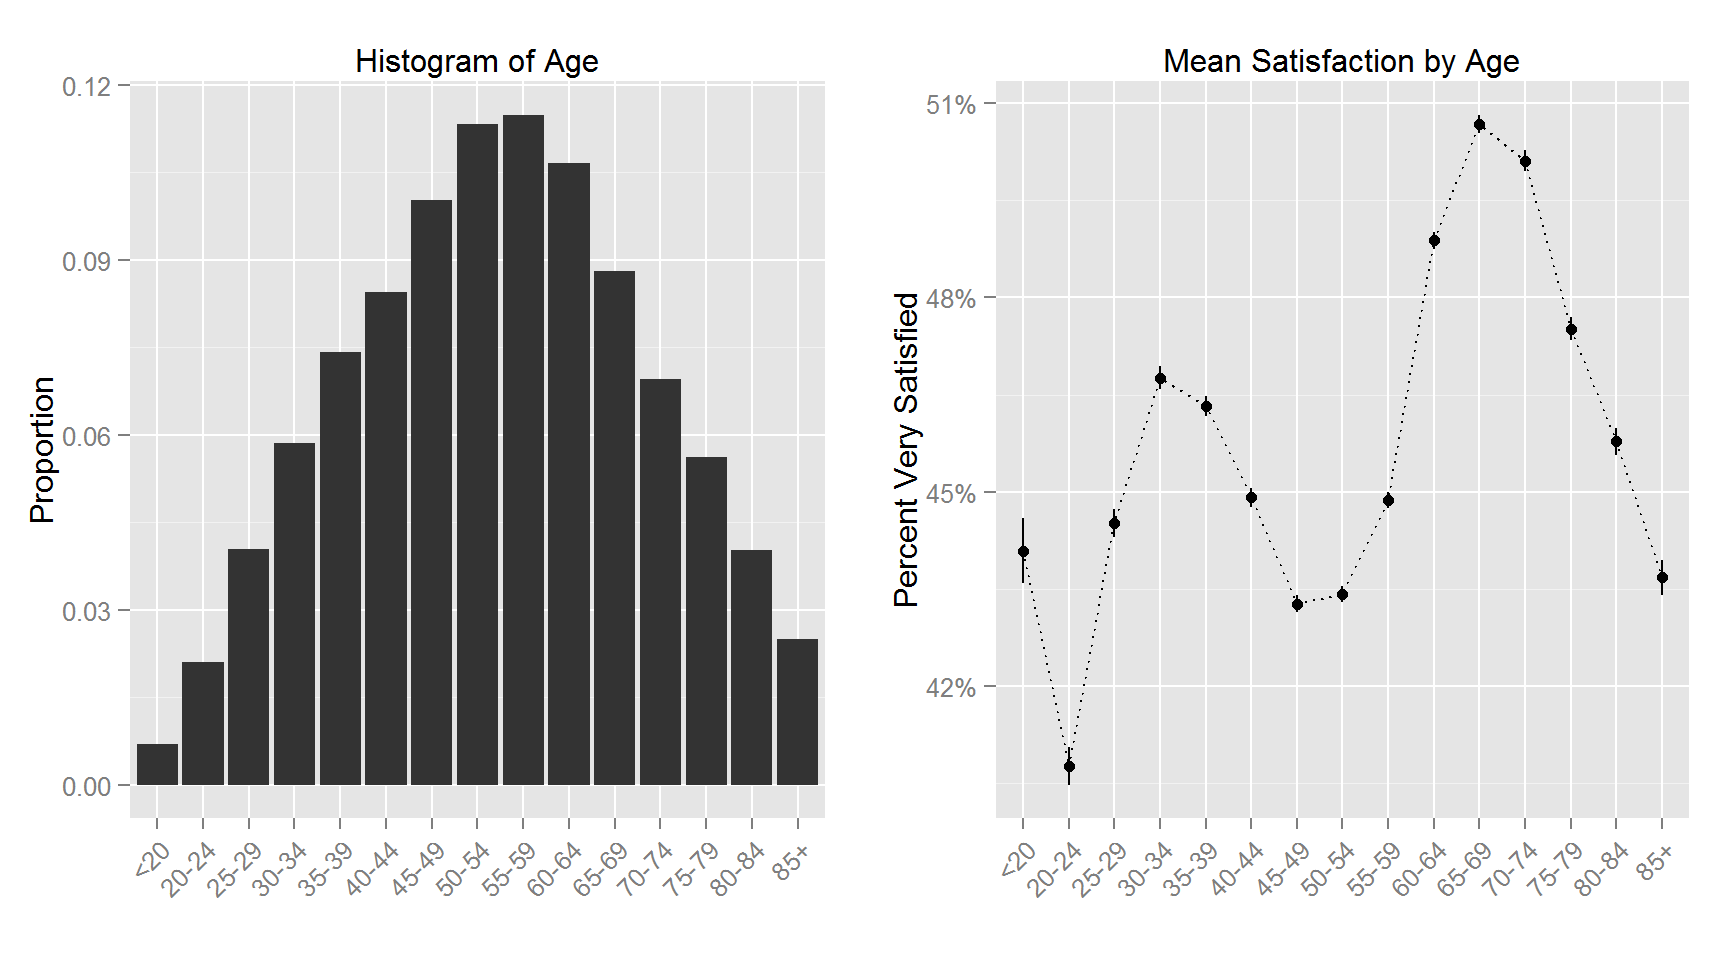
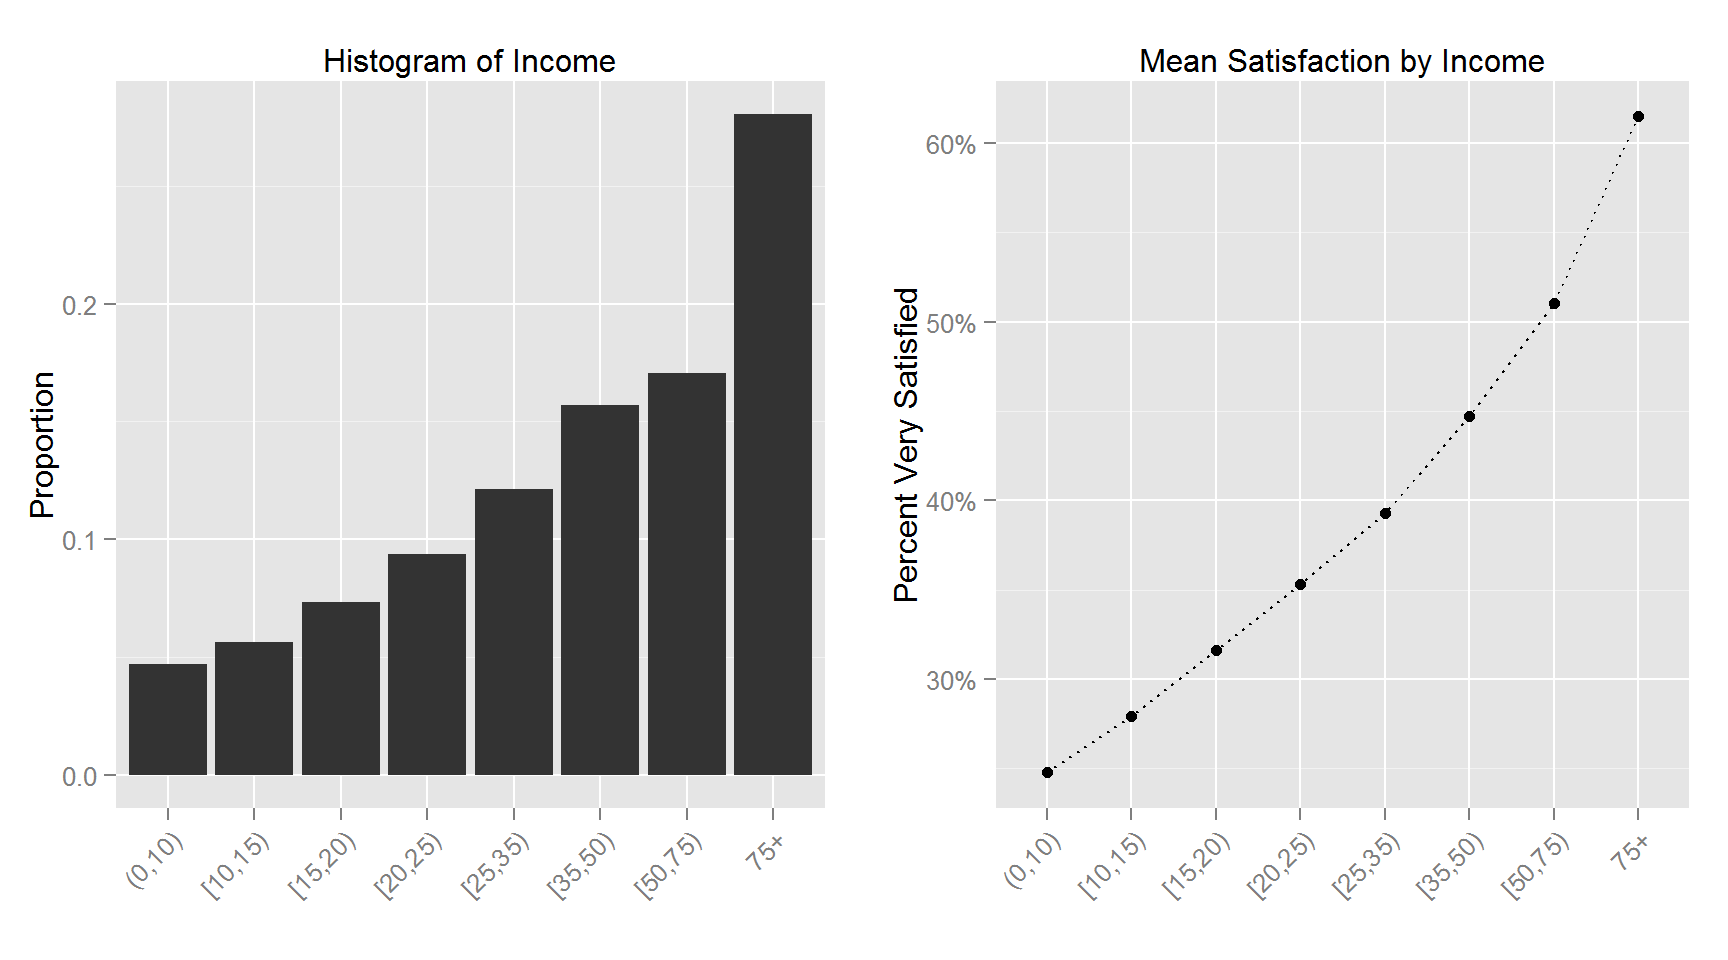
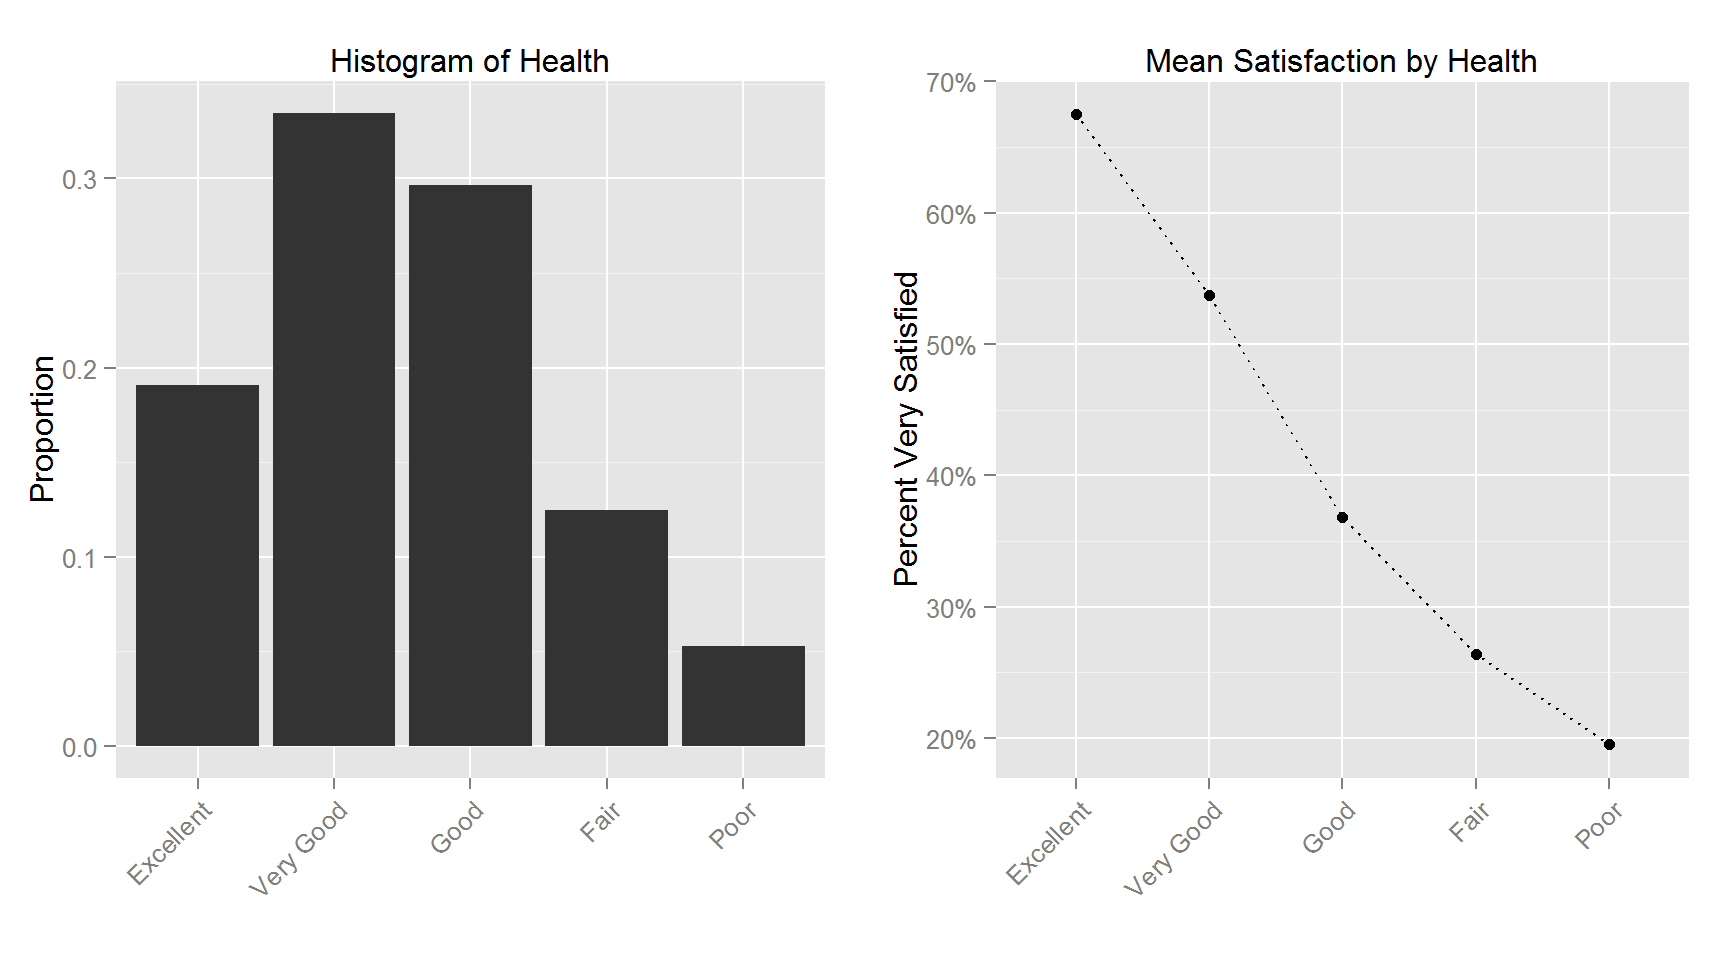
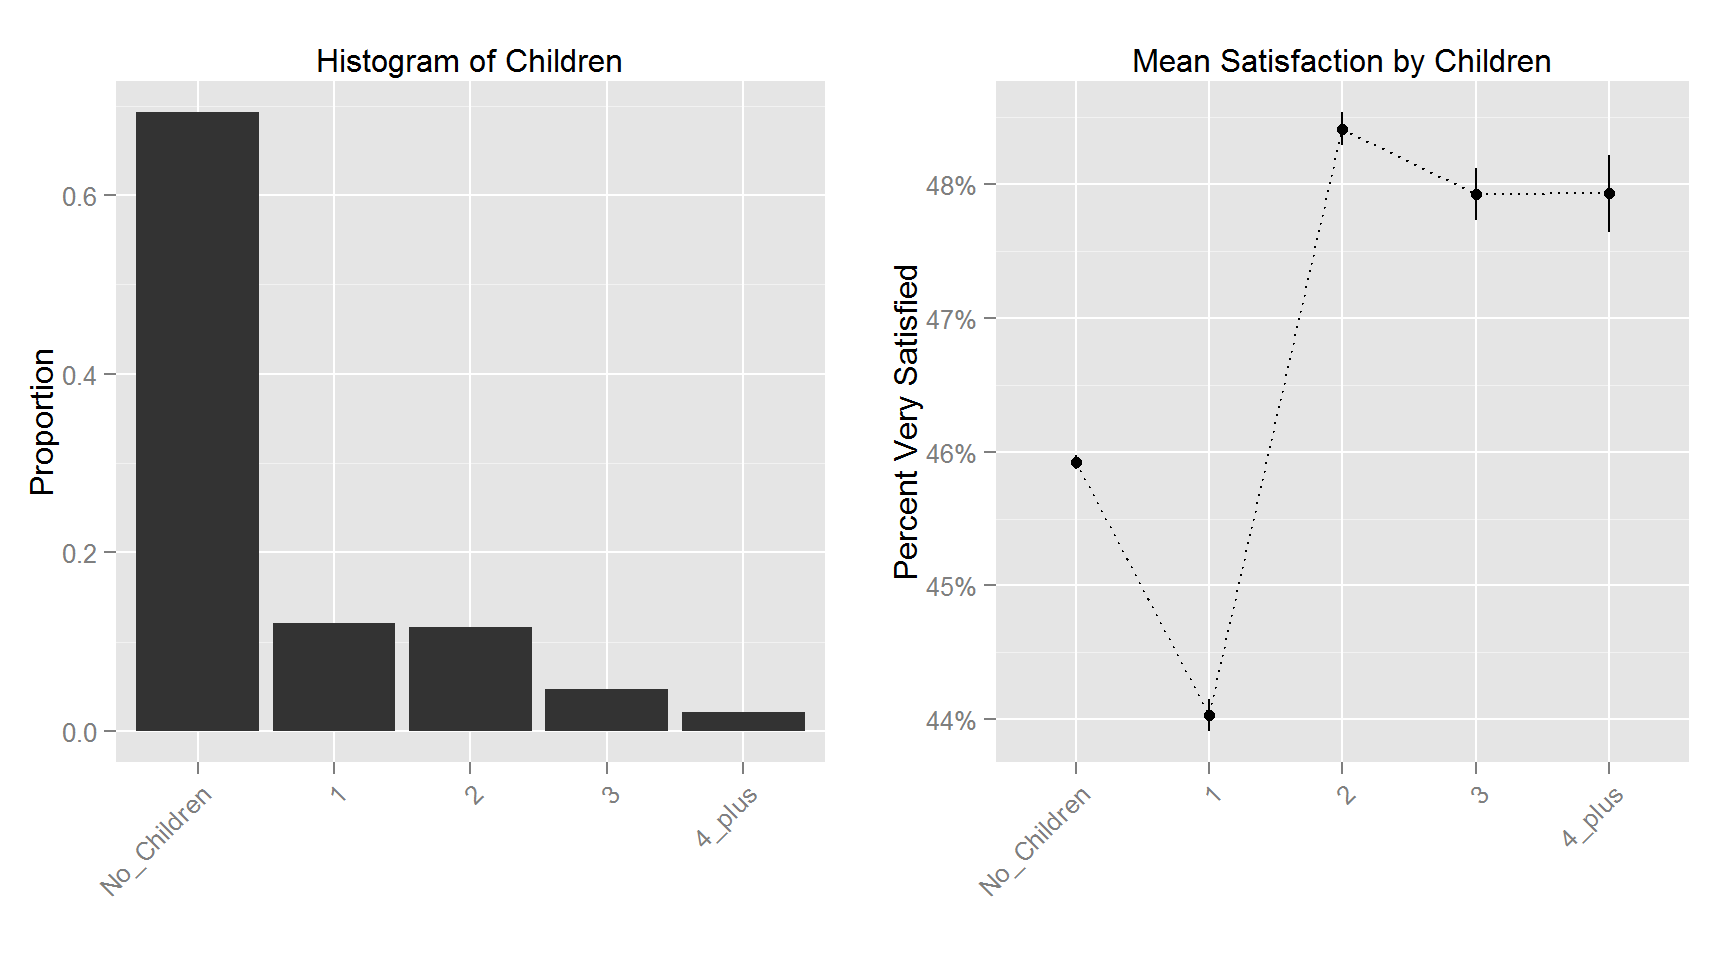
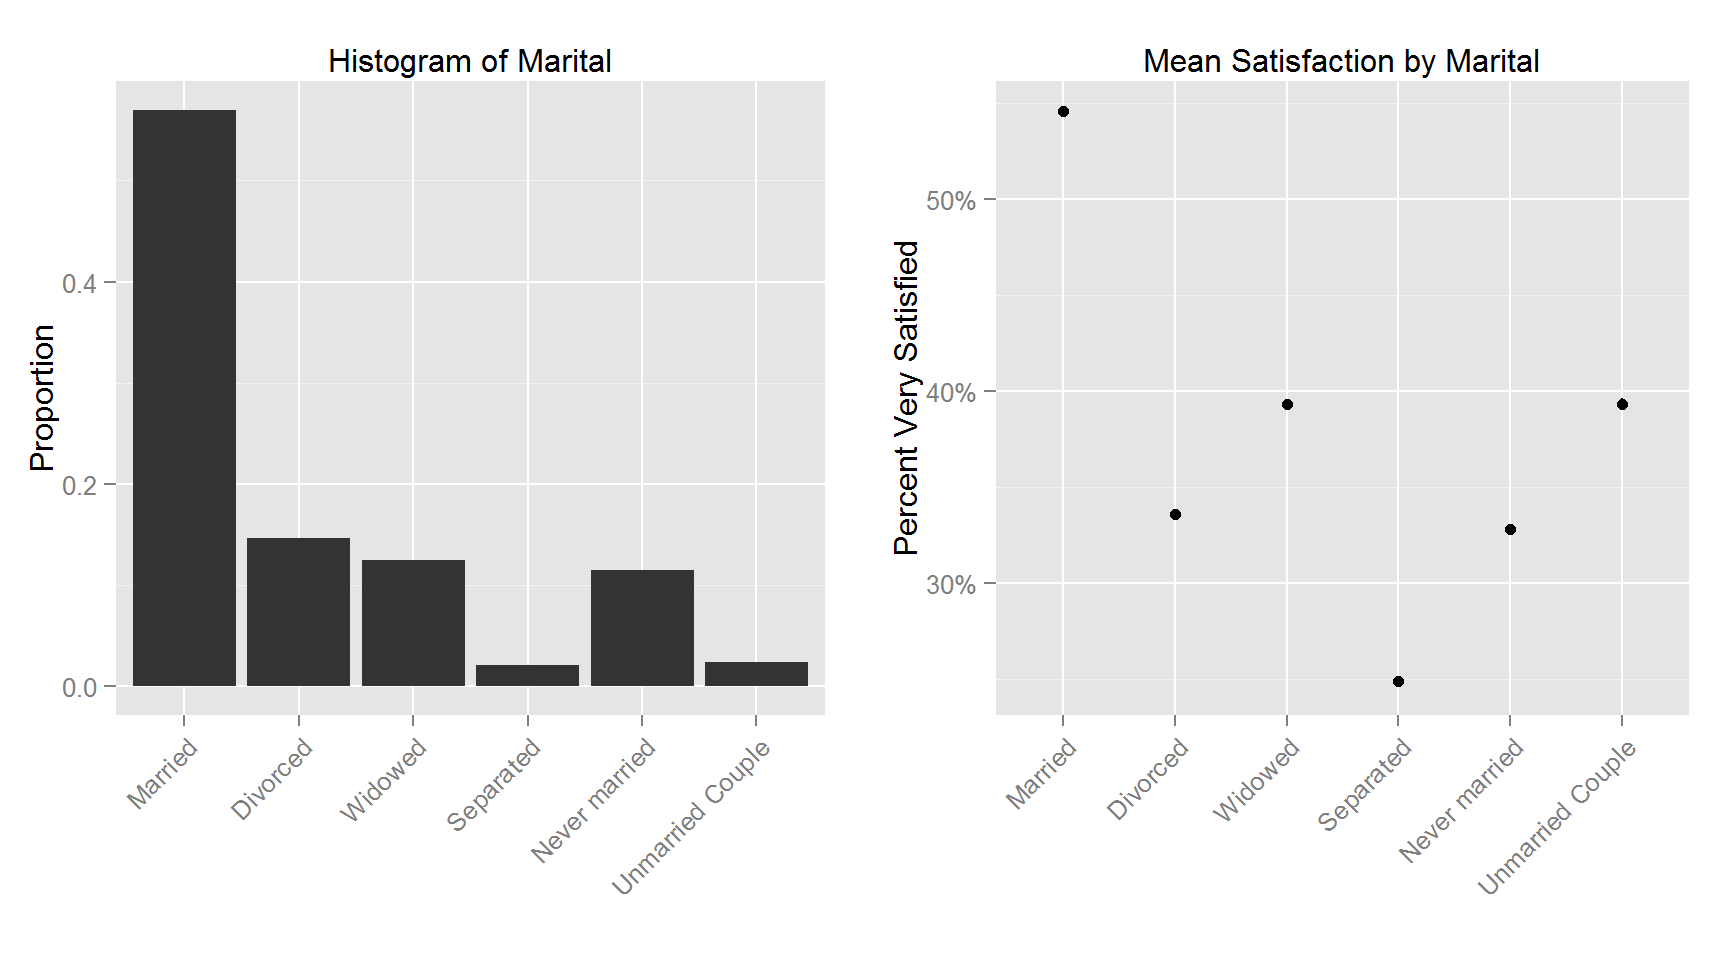
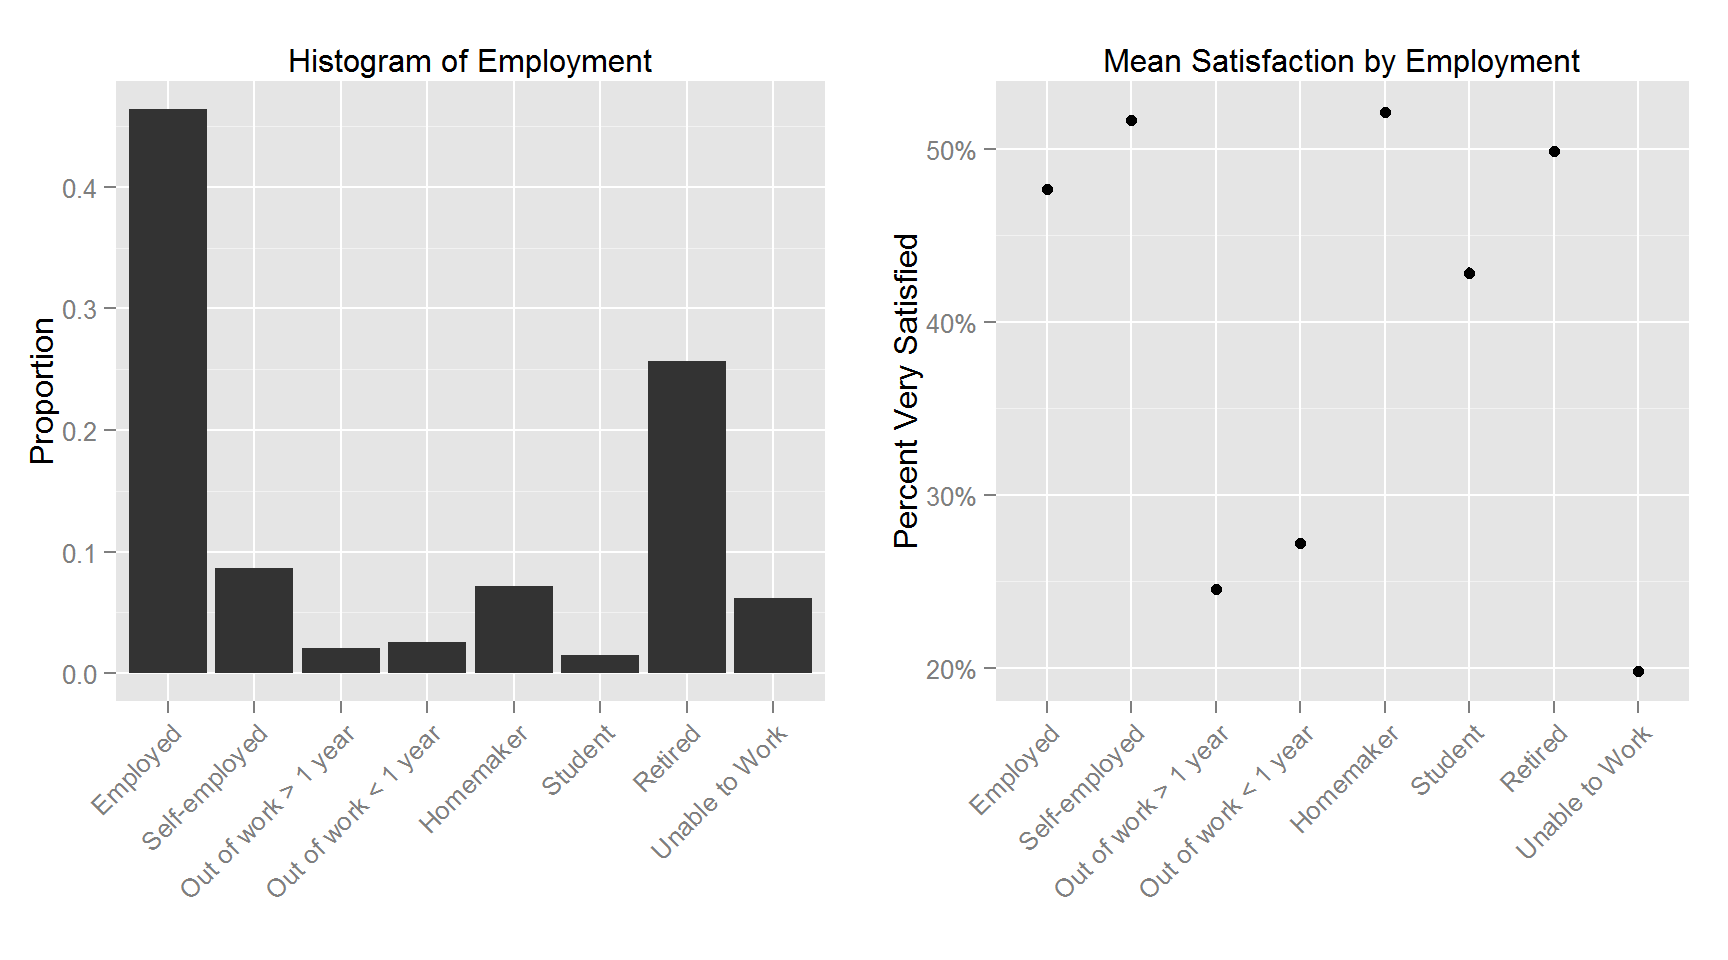
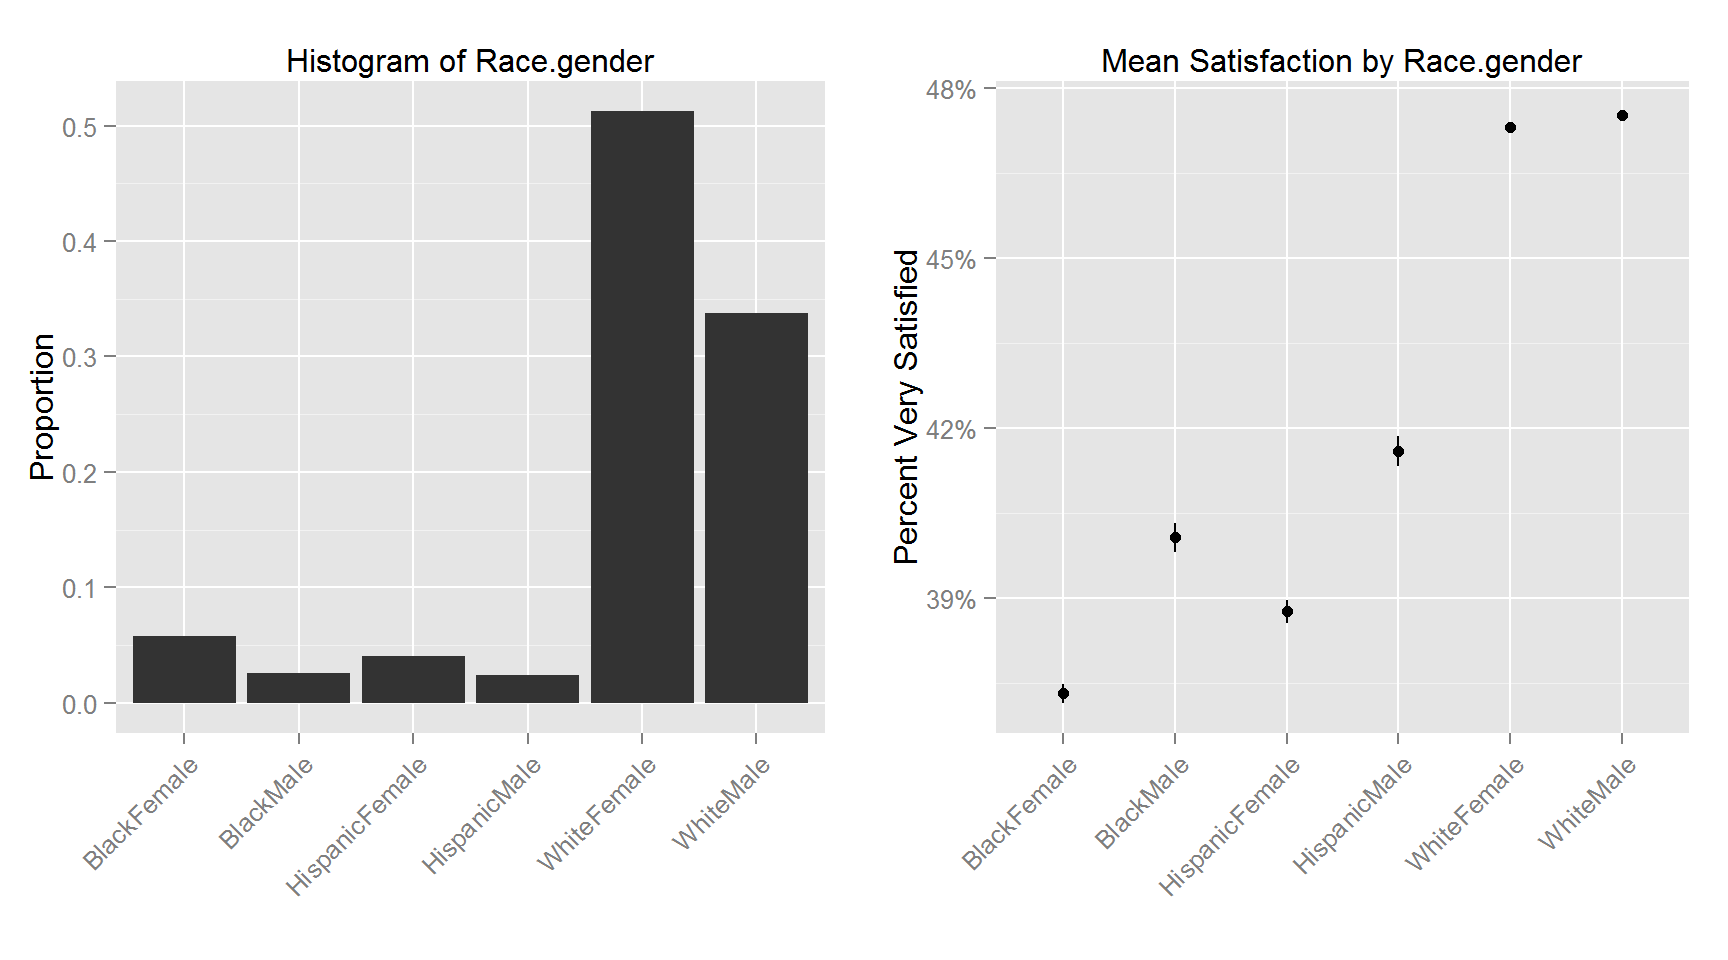
The following plots shows the histogram for each variable and the corresponding variable’s relationship with Satisfaction.
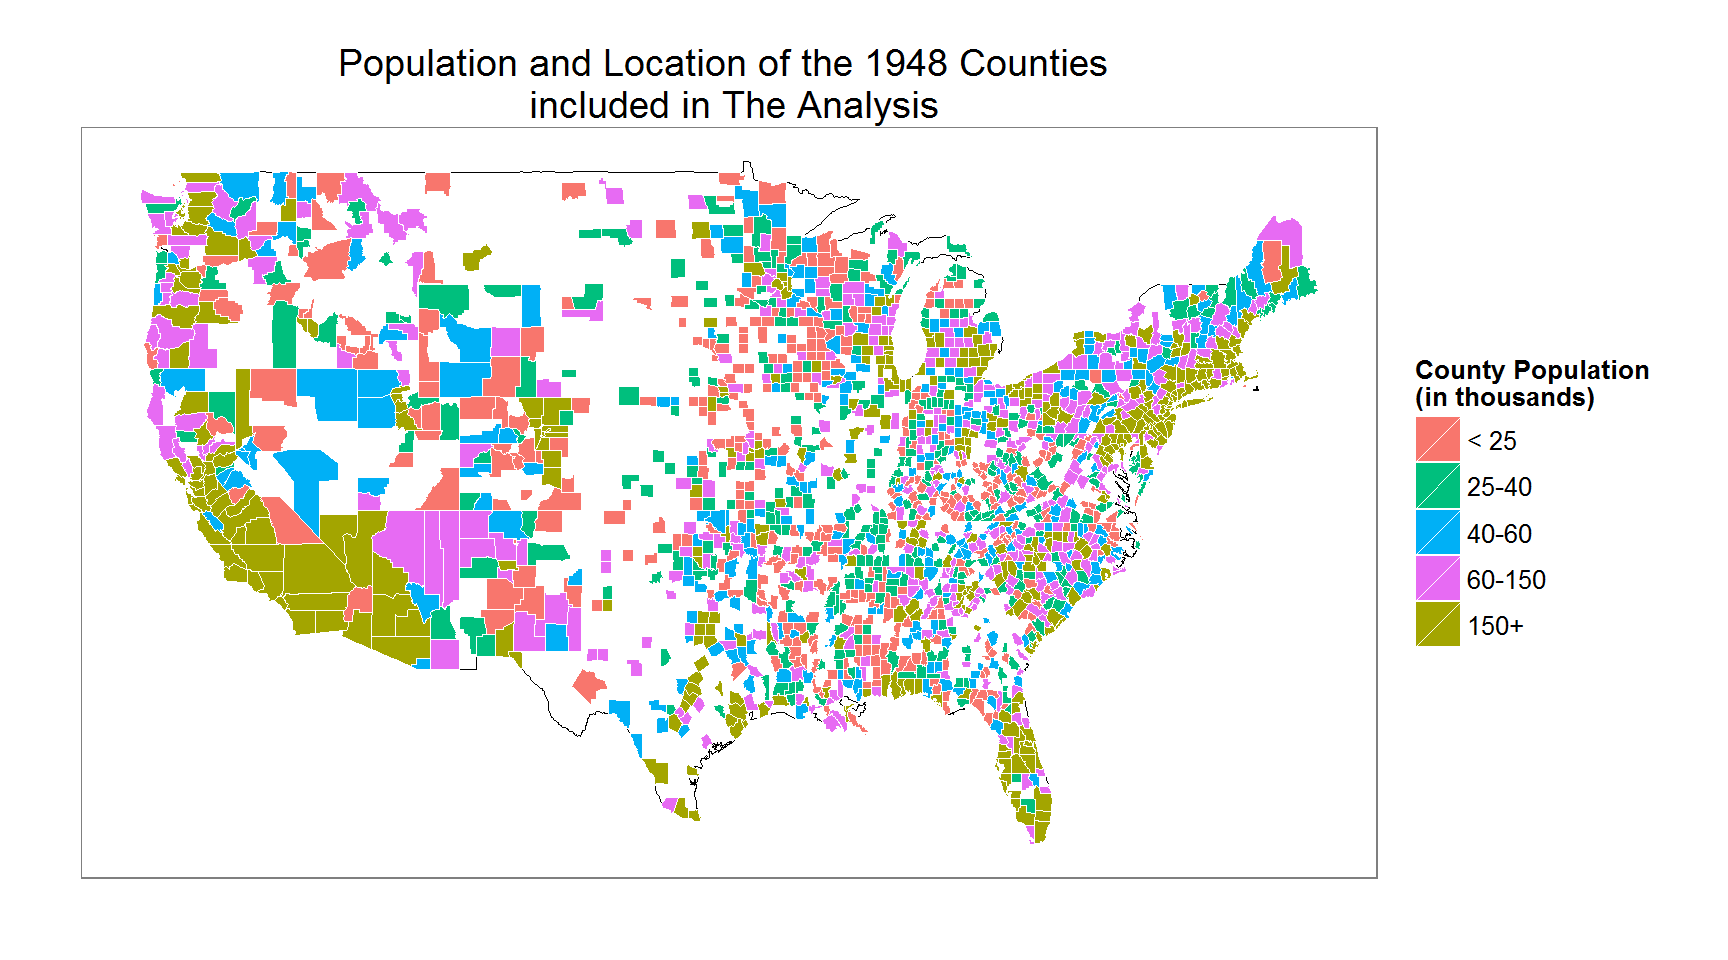
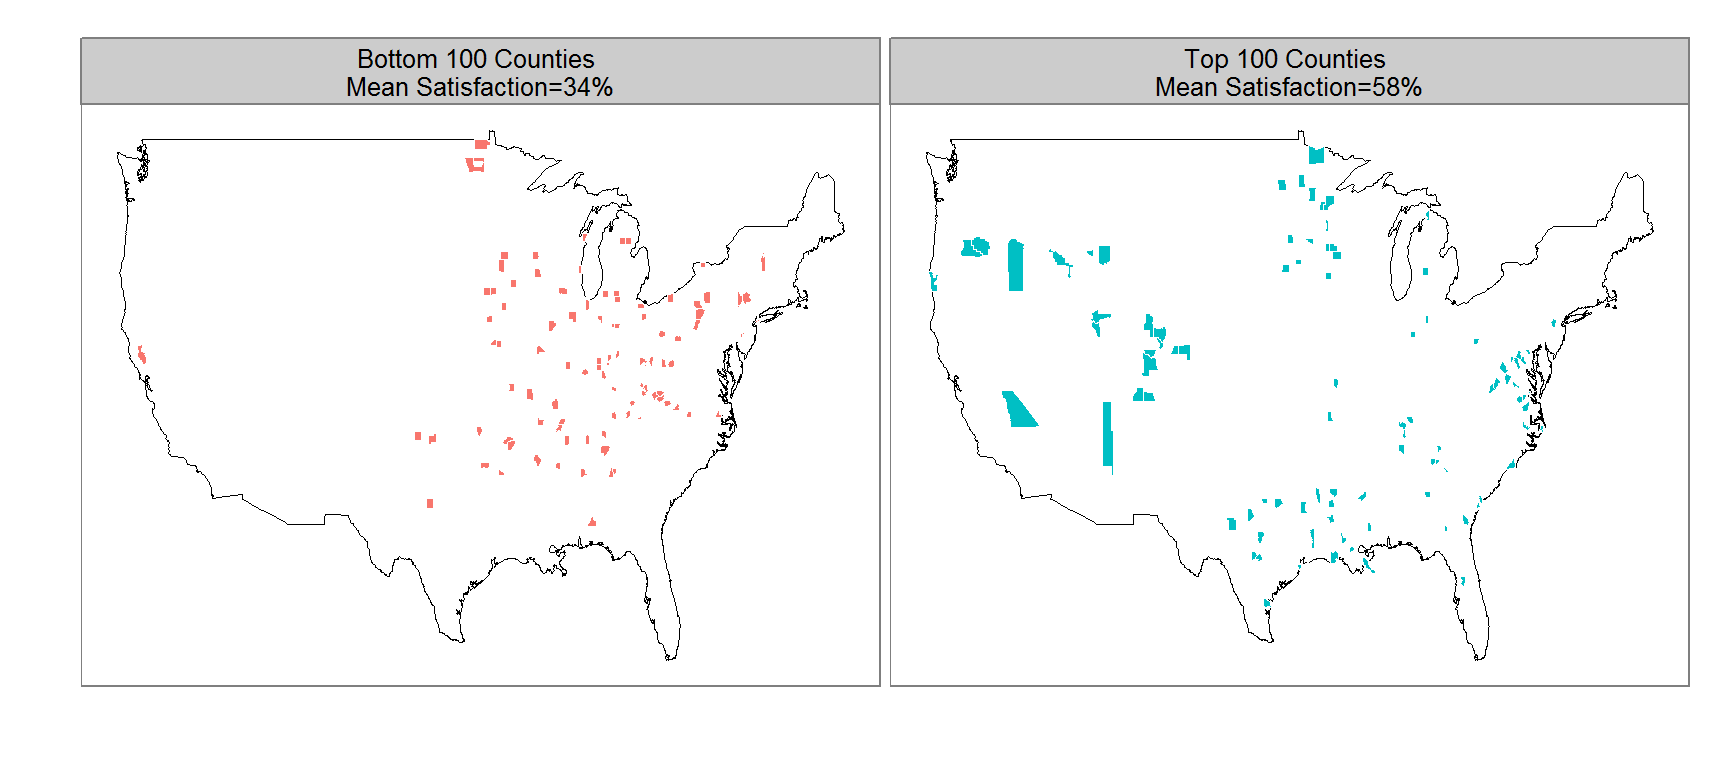
This figure shows the top and bottom 100 counties in terms of percent satisfied respondents. The least satisfied counties are primarily in the lower midwest (the “rust belt”) and upper parts of the southern region. The 100 most satisfied counties are more spread out with clusters in the upper midwest, deep south, mid-east and west section of the US.